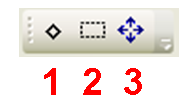
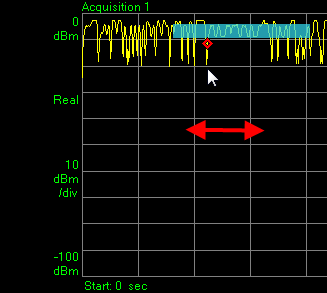
Click this icon, then move the cursor horizontally on the graph screen to drag the red diamond marker along the displayed trace.
Click this icon, then click and drag the cursor within the graph screen to outline a rectangle. This is the zoom area.
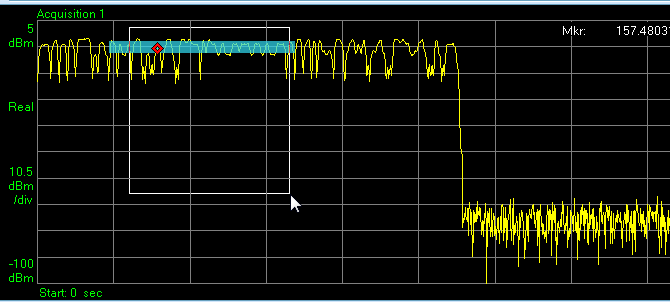
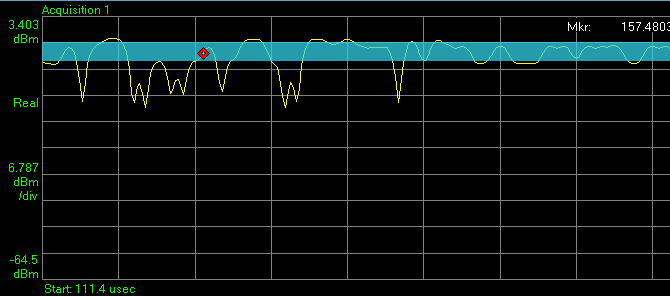
When you release the mouse button, the region of the graph which you outlined with the rectangle expands to fill the graph window.
Click this icon to cancel the effect of the zoom, and restore the automatically scaled graph view.